Together with Iain Staffell, I published two papers, available today, using reanalysis and satellite data to simulate PV and wind power plants across Europe (references at the bottom of this post). Alongside these two publications, we built a large database of measured power output data to validate the simulations and perform bias corrections. This now allows us to accurately model hypothetical European wind and PV power output over several decades, investigating issues like the impact of increasing PV deployment on net power demand:
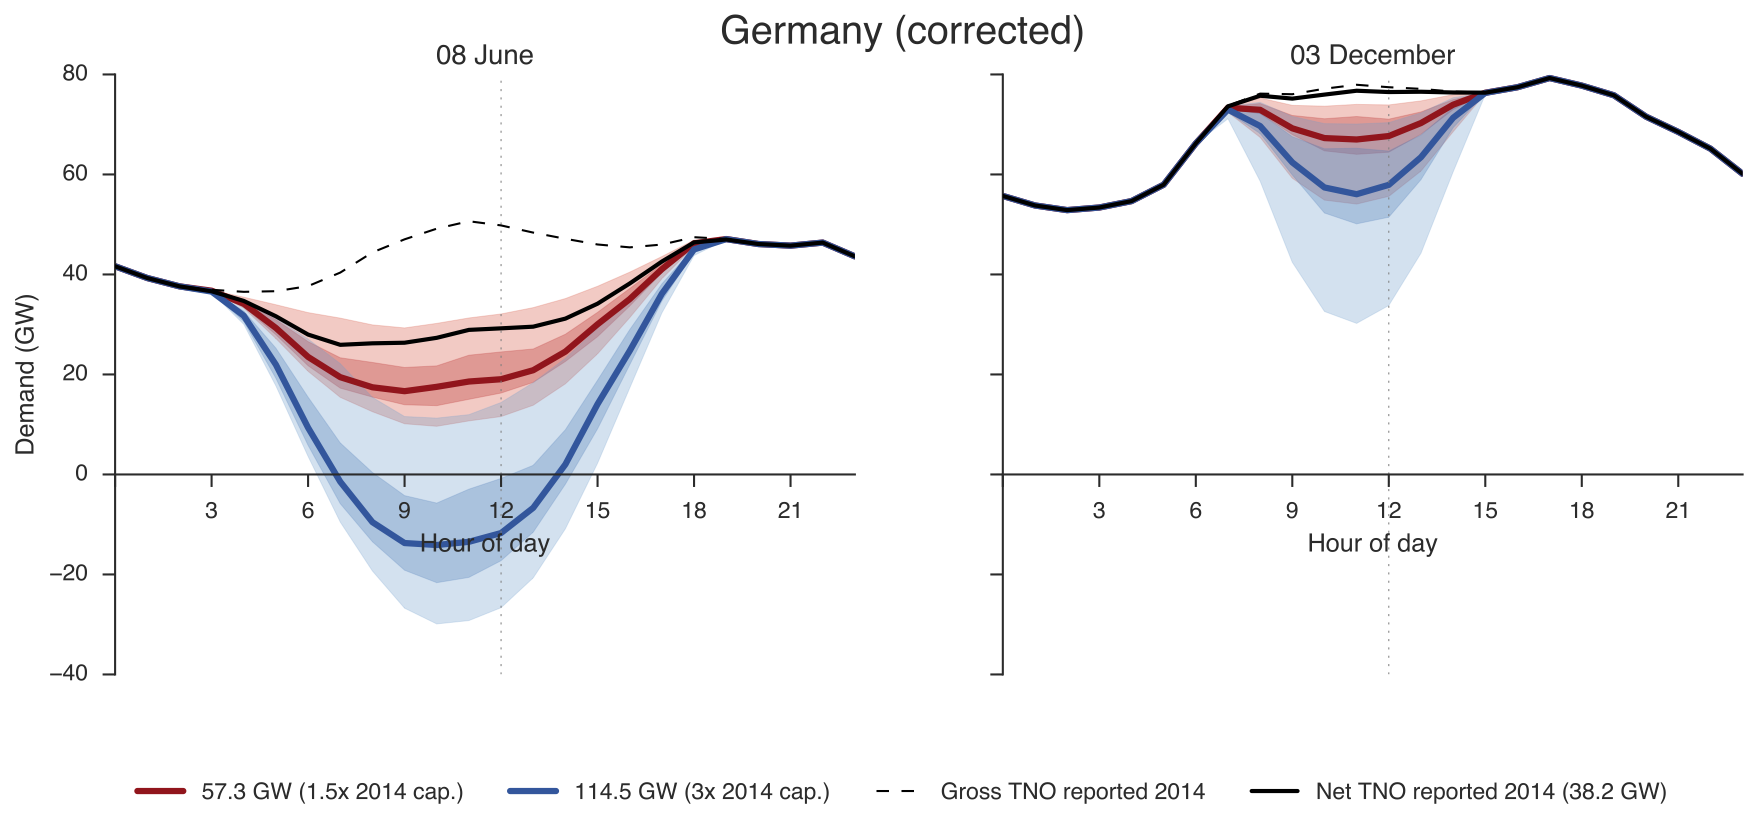
Duck curve of Germany, showing reported demand and PV production data for two days in 2014 (black lines) and the range of net demand from 30 years of simulated PV power production for 1.5 times (red) and 3 times (blue) the 2014 PV capacity. Source: Pfenninger and Staffell (2016).
There’s an Imperial College London story on both papers and an ETH Zürich news story on the wind paper.
To make the simulations available for other researchers, the Renewables.ninja platform I created and developed together with Iain Staffell alongside these two papers allows users to run simulations of the hourly power output from wind and solar power plants located anywhere in the world:
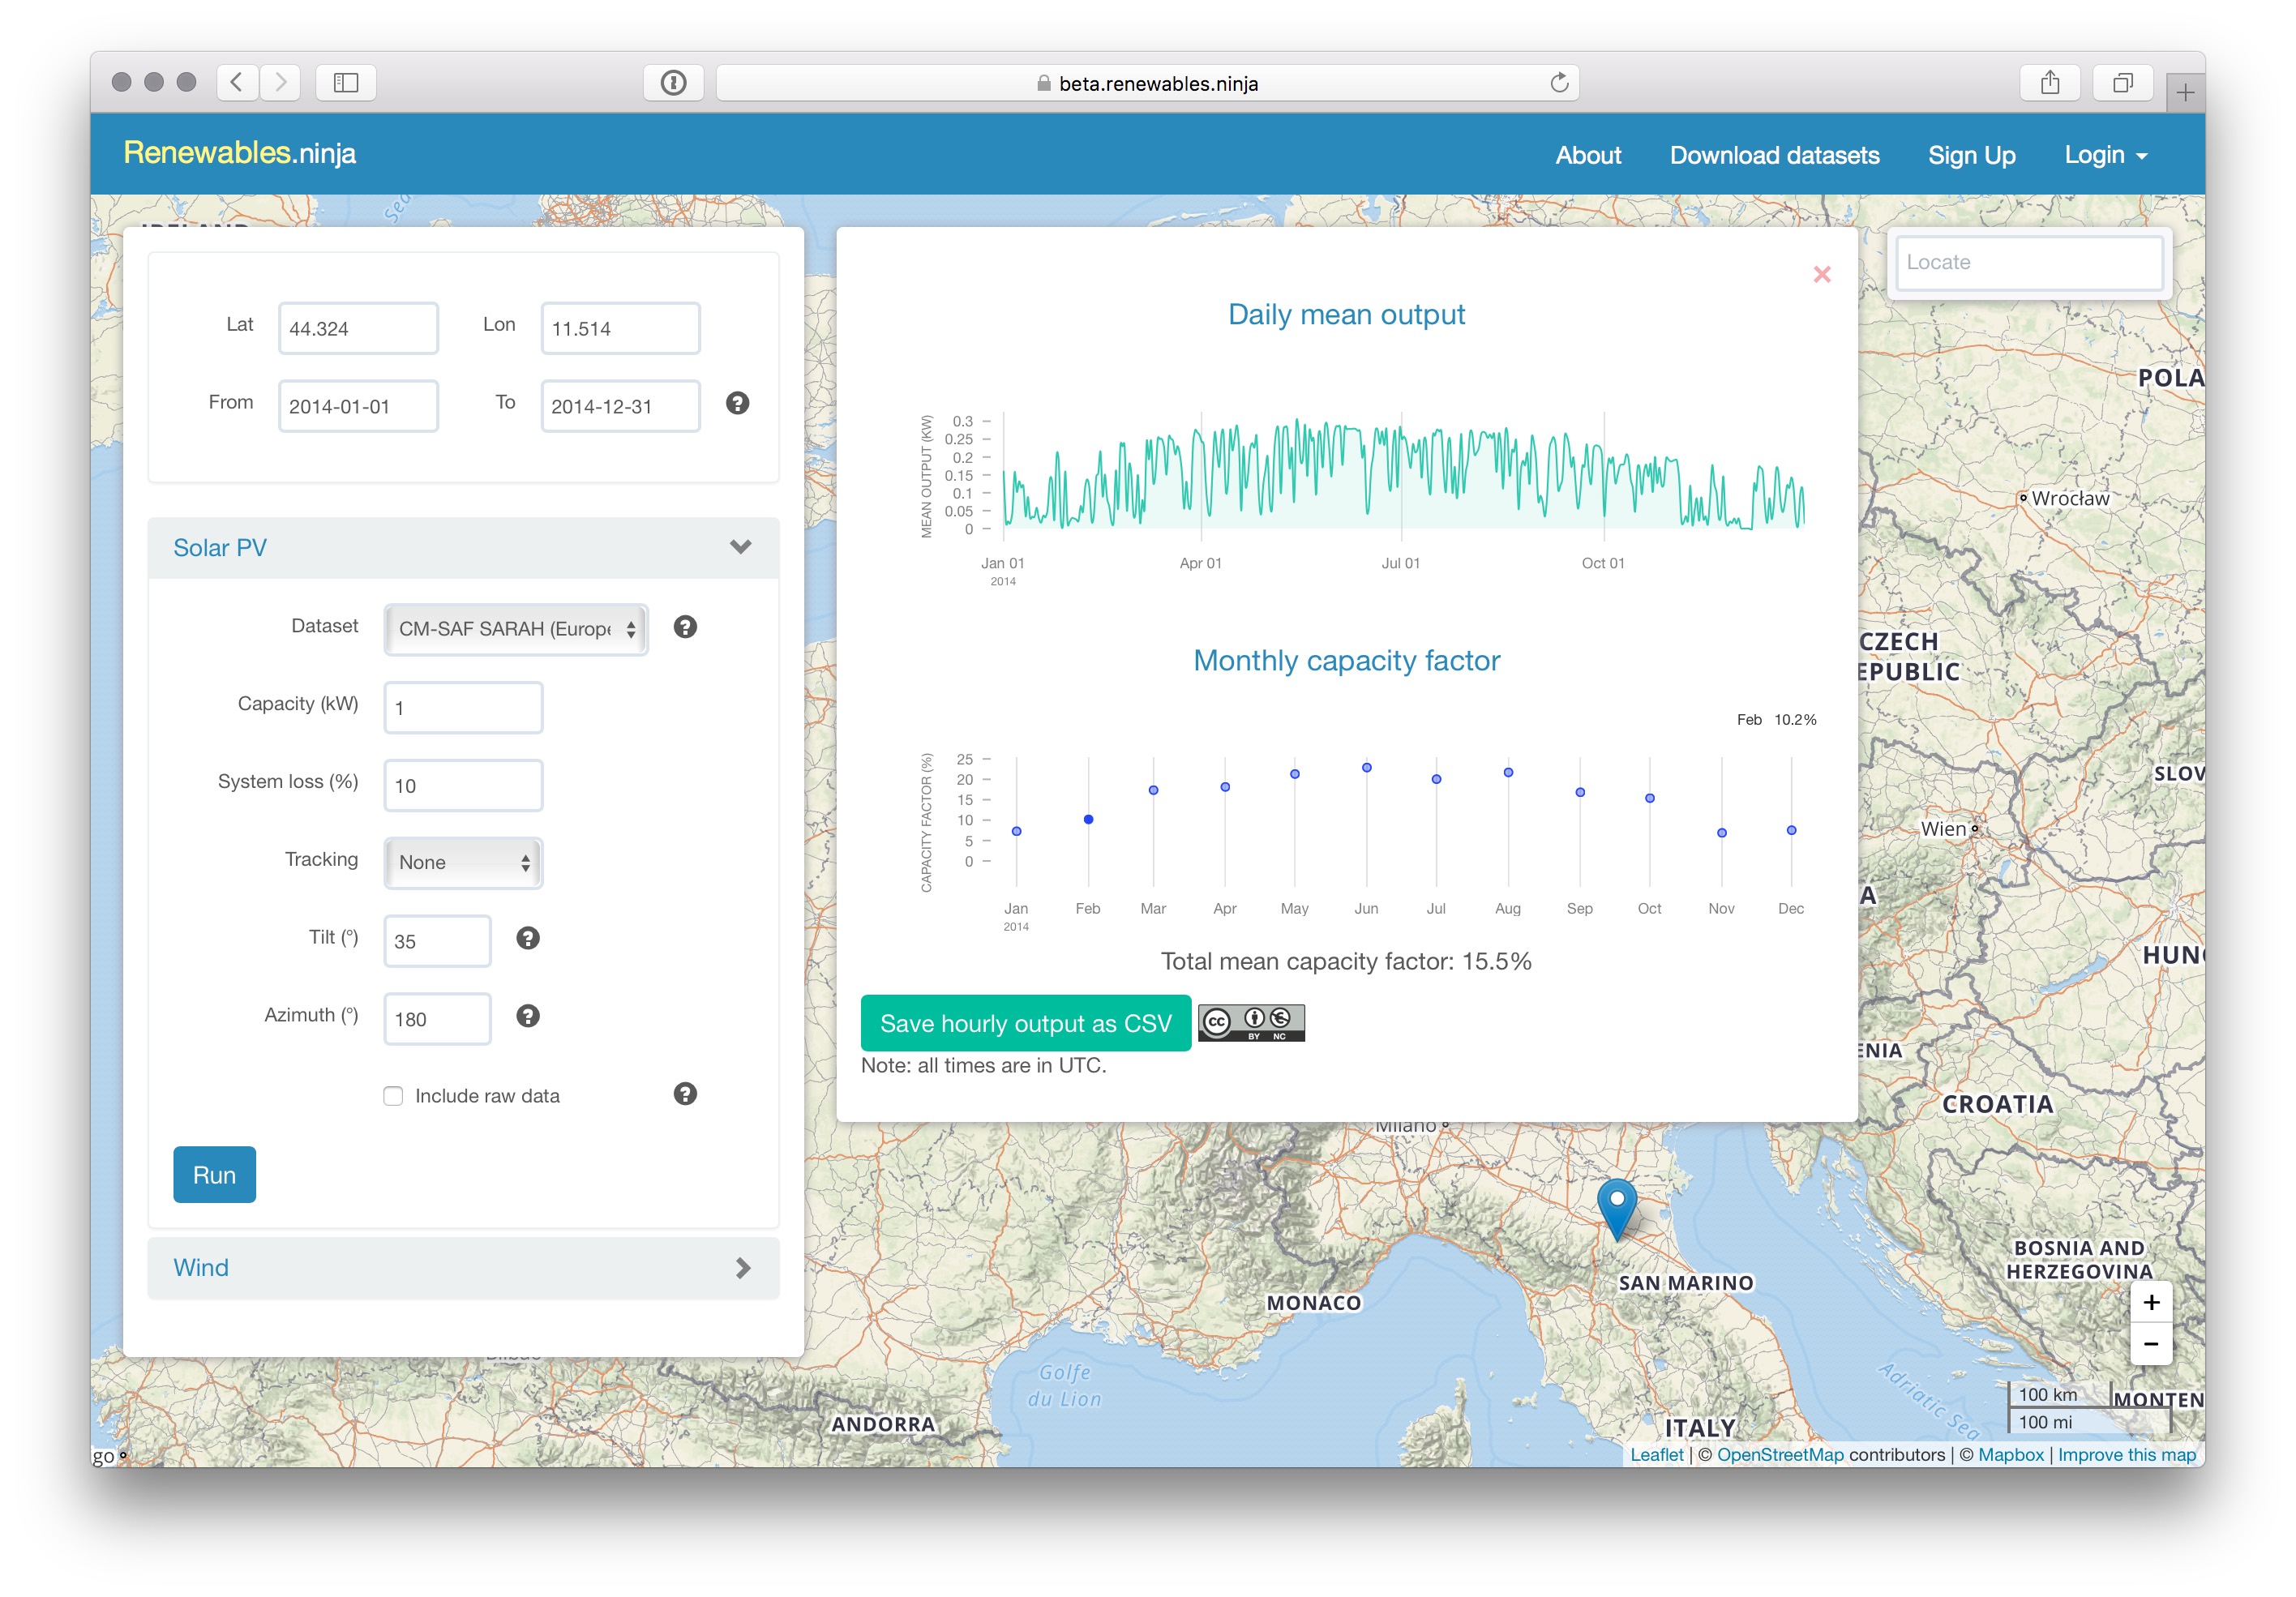
Renewables.ninja screenshot
Data from Renewables.ninja are free to use under the Creative Commons BY-NC license. The papers are both open access and fully available online. We hope to reduce parallel efforts in creating and validating such simulations, and are looking forward to seeing other people make use of our data!